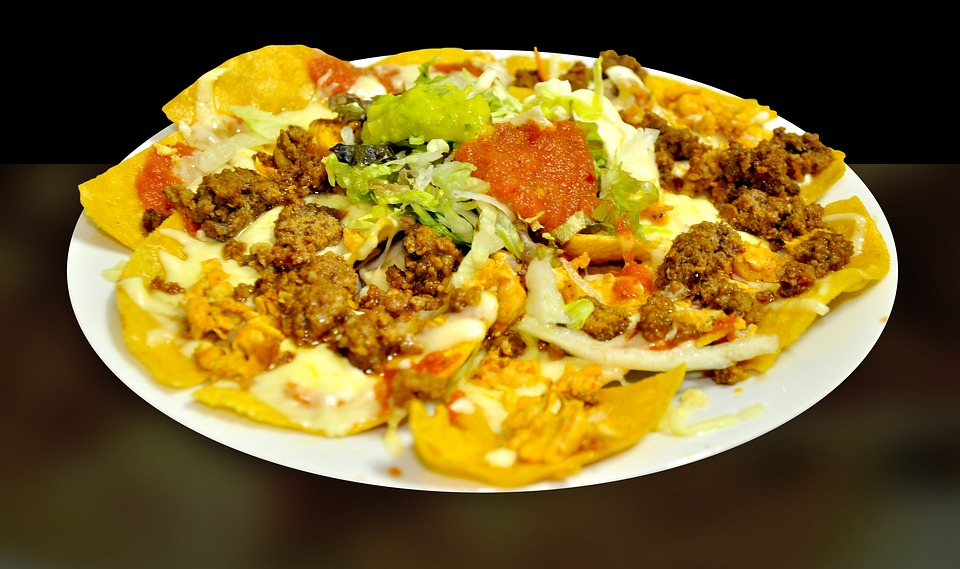
After The (Superbowl) Party Is Over…

The big game is over. Fortunes have been made…and lost. Had enough chips and dip?
In Super Bowl LII TV viewers saw Doritos chips and Avocados From Mexico as two of the advertisers. Makes sense since most football parties have both.
Each advertiser paid $5+ million per spot to advertise in the Super Bowl. And those spots are designed to make watering mouths in the 103 million estimated viewers of this year’s game. As media planners, we would calculate that to be a CPM of about $45. In our classes we teach that that means Doritos and Avocados From Mexico paid about $45 to reach every 1000 viewers.
CNBC has reported that Avocados From Mexico was one of the most talked spots after the Superbowl on social media. Time will tell if that translates into more avocado sales.
What about Doritios? They had the 4th highest rated ad, according to USA Today Ad Meter.
Just how big is Doritos? How much sales do Doritos represent to parent company PepsiCo? Doritos was the top ranked tostada chip brand of the United States with about $1.48 billion, in 2017. That’s a lot of chips.
So here’s an interesting take on some PR announced by PepsiCo. It’s about chips.
This week PepsiCo with its snacks Doritos, Cheetos and Lays chips may be announcing snacks aimed at women. An important characteristic under demographics.
Their research says that women prefer chips that “don’t make too much noise” when eaten or don’t leave their fingers sticky. Is that really an important differential?
As we are writing this post, Doritos chips are making a lot of noise…on the Internet! Seems social media is NOT in support, and think it’s in bad taste…figuratively, that is. The New York Times is watching this closely.
It does bring up the topic of segmentation, though. The 2 Guyz On Marketing teach and present five ways to segment a market. Segmentation is the breaking a market of varied potential purchasers into subgroups of specific purchasers with similar needs, desired product benefits and purchase behaviors. We teach demographics, geographics, psychographics, behavior characteristics and technographics.
Segmentation:
Breaking a market of varied potential purchasers into subgroups of specific purchasers with similar needs, desired product benefits and purchase behaviors.
Demographic Segmentation:
Age, sex, family size, family life cycle, gender, income, occupation, education, religion, race, generation, nationality, social class (is also sometimes put under psychographics.)
Geographic Segmentation:
By region, city, metro size, density, climate; plus by countries and territories.
Psychological Segmentation:
Social class–Lower lowers to Upper uppers. Social class is also under demographics.
Lifestyle— achievers, strivers, and strugglers
Personality— Compulsive, gregarious, authoritarian, and ambitious
Lifestyles/Attitudes/Interests and Opinions
Behavioral Segmentation:
Occasions (regular occasions, special occasions, holidays, vacations). Orange juice for breakfast, Mother’s Day, Father’s Day.
Benefits (quality, service, economy, convenience, speed—Quality, Time, Money)
User status (nonuser, ex-user, potential user, first-time user, regular user)
Usage rate (light, medium, heavy user)
Loyalty status (none, medium, strong, absolute)
Readiness attitude toward product (aware, interest, desire, intending to buy),
Attitude toward product (enthusiastic, positive, indifferent, negative, hostile[1]).
Technographical Segmentation
Another way to segment has been added to marketing’s segmentation, targeting and positioning. It is called “Technographics.” In our research, we have studied what technologies different segments or groups of people use and how they use them. What are your “people” using?
We’ll see what they will be launching in the near future, obviously after huge sales of chips for those parties last weekend.


